TTS Leaderboard Methodology and Benchmark Blind Spots
Standard TTS benchmarks measure naturalness alone, missing five critical production dimensions.

Text-to-speech evaluation grew up in an era when the main question was simple: did this voice sound like a robot? Human-preference Elo scoring and Mean Opinion Score panels both date to that era, and both were built to do one job: catch the gap between a synthetic voice and a human one. Modern neural TTS has mostly closed that gap. The tools built to measure it are now answering a question nobody is asking anymore. MOS asks a listener to rate naturalness on a five-point scale and hand back one number. That works fine when systems are spread out across the scale, from clearly robotic to clearly human. It stops working once the top systems bunch up near the ceiling and become hard to tell apart from each other, or from real recordings. Elo preference arenas came along as the crowdsourced fix, pitting two clips against each other and letting listener votes do the ranking. But the fix kept the frame it replaced: short clips, one language, judged on naturalness alone. The industry changed the measuring stick's handle but not what the stick measures, and that's the structural root of every blind spot that follows.
What the Artificial Analysis Speech Arena measures, and what it does not
The Artificial Analysis Speech Arena is the leaderboard most people mean when they cite "the TTS leaderboard." It works by blind pairwise comparison: two clips, one listener vote, repeated at scale until an Elo score falls out the other end. In a snapshot taken July 16, 2026, the arena covered dozens of models, with Qwen-Audio-3.0-TTS-Plus in first place at an Elo of 1,237. That ranking looks decisive, but check the confidence interval and it overlaps with Simba 3.2's. The leaderboard puts Qwen-Audio-3.0-TTS-Plus first because its point estimate is slightly higher, not because the data shows it's reliably better. The arena's scope is also narrower than its reputation suggests. It evaluates English audio using each provider's default voice, and you don't get latency measured inside the arena itself, though Artificial Analysis runs separate throughput and speed benchmarks and includes a Pronunciation Robustness metric. Multilingual arena leaderboards now cover 9 languages beyond English. The scope is simply narrow, and a narrow scope treated as a universal verdict is where the trouble starts.
Leaderboard Gaming and Integrity Failures
Even inside that narrow scope, the vote itself isn't always clean. Fish Audio's blind production test, run as a vendor evaluating its own position in the market, points to a structural weakness shared across public leaderboards: they test short, simple sentences, often a single line of dialogue or a brief narration, which leaves long-form content, multi-speaker dialogue, expressive prosody tags, and multilingual text completely untested. That same July 16, 2026 snapshot shows ranks 3 through 7 statistically tied, their confidence intervals overlapping enough that picking a vendor by ordinal position alone is picking by noise, not signal. Fish Audio's methodology note adds a sharper problem: TTS-Arena-V2 has had documented issues with audio header leaking, where metadata embedded in the audio file reveals which provider generated it. A blind test isn't blind once the file tells the listener, or the system, who made it. None of this requires assuming bad actors. The incentive structure does the work on its own: providers that optimize for benchmark sentences, submit cherry-picked checkpoints, or benefit from coordinated voting will outperform providers that don't bother, regardless of which one builds a better product for actual production traffic. A public leaderboard, under those conditions, functions partly as a marketing channel. Vendor-published benchmarks carry a related flaw in a different shape: the shortest sample text, the best network, and one optimized voice are all tuned to show the system's best day.
Why naturalness cannot be a single scalar construct for production evaluation
Setting the integrity problems aside, the deeper issue remains: even an honest vote on short, clean utterances is answering a thinner question than "which model is better. Word Error Rate, the usual stand-in for intelligibility, doesn't fix this either. Fish Audio's methodology notes that chasing a lower WER often pushes a model toward hyper-articulated, over-enunciated speech that trades away naturalness and prosody to hit the number. A model that mumbles occasionally, the way a real person does, can sound more convincing than one that pronounces every syllable like a courtroom stenographer. Naturalness also isn't portable across context. A voice tuned for read-aloud news copy won't necessarily hold up in a back-and-forth conversation, an emotionally charged piece of fiction, or a technical walkthrough full of part numbers. Each of those contexts rewards a different acoustic behavior, and a single preference vote between two clips can't tell you which quality drove the result. The MINT-Bench framework names this directly: existing evaluation protocols often lack the diagnostic granularity to separate three distinct failure types, content errors, weak execution of an instruction, and degraded perceptual quality. Those are three different bugs with three different fixes, and a scalar score collapses them into one undifferentiated verdict.
The five production dimensions that standard benchmarks leave unmeasured
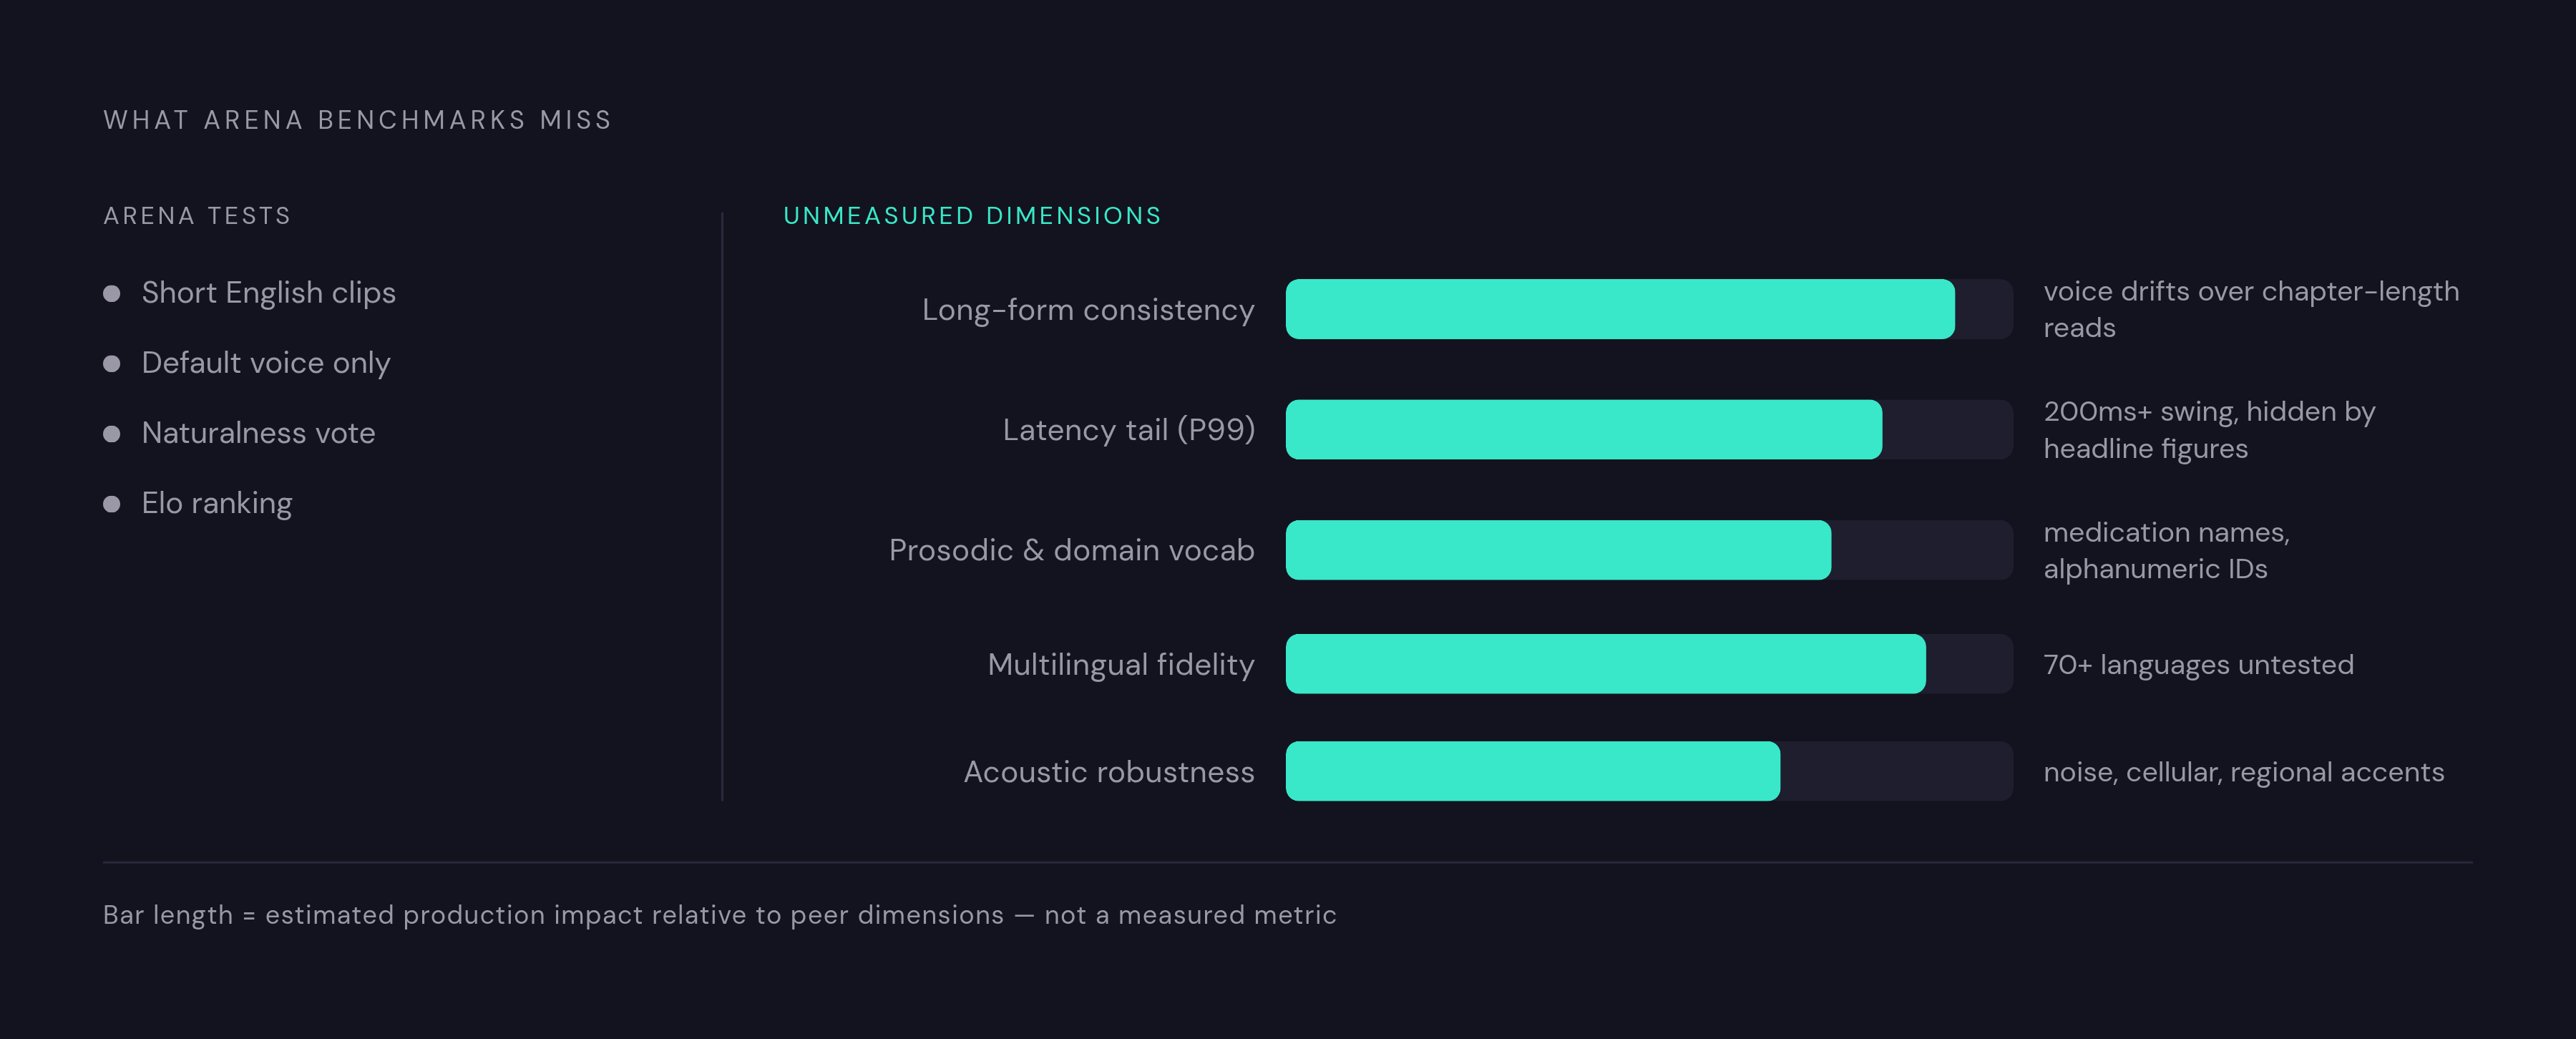
Long-form consistency is the first gap. A short-utterance test has no way to catch a voice that drifts in timbre, pacing, or energy over a chapter-length read. Qwen-Audio-3.0-TTS treats one-pass synthesis up to 3 minutes as its own engineering target, because standard benchmarks never test for it.
Latency tail behavior is the second. Vendors typically report time-to-first-byte under ideal lab conditions, a number that can sit 300 to 500 milliseconds below the total voice-to-voice latency a cascaded production stack actually delivers. A headline of "sub-150ms" that skips the percentile hides what matters: P99 latency, the number a caller experiences on a bad network day, can swing by 200 milliseconds or more between two vendors advertising the same round headline figure.
Prosodic control and domain vocabulary make up the third gap. Demo reels handle general English smoothly and then stumble on medication names, alphanumeric account IDs, or industry-specific jargon, a failure mode that appears on a preference vote built on generic sentences but never surfaces there.
Multilingual fidelity is the fourth. The Artificial Analysis arena scores English on default voices only, which leaves accent handling, cross-lingual prosody, and non-English coverage entirely untested by the most-cited source in the field, a blank spot for anyone buying for a multilingual deployment.
Robustness under adverse acoustic conditions rounds out the list. Qwen-Audio-3.0-TTS calls out noisy, reverberant, or unclear reference speech as a distinct problem to solve, and production systems meet exactly that: hold music bleeding through a call, a spotty cellular connection, a caller with a regional accent the lab recording never modeled.
Who pays the highest cost when benchmarks miss these dimensions
Low-resource language communities absorb the sharpest version of this cost. Neural TTS quality has improved unevenly across the world's languages, only a handful of multilingual providers offer coverage beyond a small slice of them, and no public leaderboard tracks fidelity in the languages where that gap runs deepest. Conversational AI deployments hit a different wall: benchmarks built around reading text aloud don't measure what makes dialogue feel like a conversation, things like reduced pitch variation, longer pauses before an answer, limited adaptation to dialect, and weak emotional mirroring, all invisible to a preference vote scored on narration clips. Voice cloning exposes a third gap, between how well a clone matches a target voice and whether it actually says the right words. A preference vote rewards timbre match and doesn't penalize garbled or dropped content, and a community benchmark found this: OmniVoice topped voice-match preference voting despite being able to garble or drop words. Read that result for what it measures, best timbre match, not best overall clone, and treat WER as the number built to catch what the preference vote misses. Enterprise and developer teams making stack decisions off preference rankings sit on the receiving end of all three gaps at once: the traffic conditions that produce a strong Elo score look nothing like a production deployment running at scale under real load.
What a production-grade evaluation requires
Experienced teams don't throw out leaderboards, they add layers underneath them. Independent continuous benchmarks that run under live traffic are the clearest step up. The Coval TTS benchmark tracks Time to First Audio, the P25 to P75 latency spread, and Word Error Rate under continuous production conditions with an open-source methodology, so it comes closest to a production-grade alternative to preference-only arenas. A project-specific blind test adds the layer a public leaderboard can't provide: it should log model and provider versions, voice, language, settings, hardware or API used, latency, any failed renders, who the listeners were, how many samples they heard, how much they agreed or disagreed, and any pronunciation corrections needed. Quality, speed, licensing rights, cost, and data handling should be scored as five separate line items, not folded into one ordinal rank that hides which one is actually driving the number. Latency specifically has to be read at the percentile where failure appears: P50 numbers look nearly identical across vendors, while P95 and P99 carry the real spread. Since June 3, 2026, the Coval board's perceived time-to-first-audio metric counts leading silence inside the stream, which brings the number closer to what a caller actually sits through while waiting for a voice to start talking. Multi-vendor strategies, running a primary provider with a fallback, splitting traffic, or routing by task, exist for a reason: no single leaderboard rank guarantees a system holds up across the full range of inputs a production deployment will throw at it.
Narrowing the Evaluation Gap with Broad Production Scope
A platform built for production deployment tends to close several of these gaps as a side effect of its engineering choices. Low-latency streaming models, native-quality multilingual coverage across more than 70 languages, and separate model tracks for content generation versus real-time conversational agents all address dimensions that short-utterance preference arenas simply don't touch. That split between content and conversation use cases matters on its own terms: a model tuned for long-form audiobook narration and a model tuned for a sub-100ms conversational response are built to solve two different problems, and scoring both against the same short-utterance preference vote can't tell a buyer which one fits which job. Prosodic control through natural-language instructions and inline tags, along with stability when the reference audio is noisy or reverberant, are the kind of capabilities that appear on a support call but not in an arena vote. Qwen-Audio-3.0-TTS's technical report lists them as distinct engineering targets. Enterprise buyers in regulated industries have a compliance layer stacked on top of all of this. The EU AI Act's Article 50 disclosure obligation took effect on August 2, 2026, and it adds a requirement no preference leaderboard scores at all: deployment now has to account for watermarking, consent infrastructure, and an auditable data path, alongside however the audio sounds.
Reading a TTS leaderboard without being misled
An Elo score on a public arena tells a buyer one specific thing: which model a population of English-speaking, tech-adjacent listeners preferred on short, general-text clips under controlled conditions. Reading more into it than that is where procurement goes wrong. The Artificial Analysis arena earns its place as a discovery tool and a shortlist filter, not as a final verdict. Note the date of the snapshot alongside the score, check which model and provider versions were actually in the comparison, and treat any score difference sitting inside overlapping confidence intervals as a tie. From there, layer in latency percentile data from an independent continuous benchmark, run pronunciation checks on the actual domain vocabulary with native-speaker raters, and test multilingual fidelity directly in whichever languages the deployment needs rather than trusting an English-only aggregate score to stand in for the rest of the world. Used together, the arena narrows the field, the continuous benchmark checks it under real load, and the project-specific test makes the final call. Know what each layer measures.