Neural TTS Model Evaluation Metrics for Production Selection
Mean Opinion Score hits its ceiling when top systems cluster near perfection.

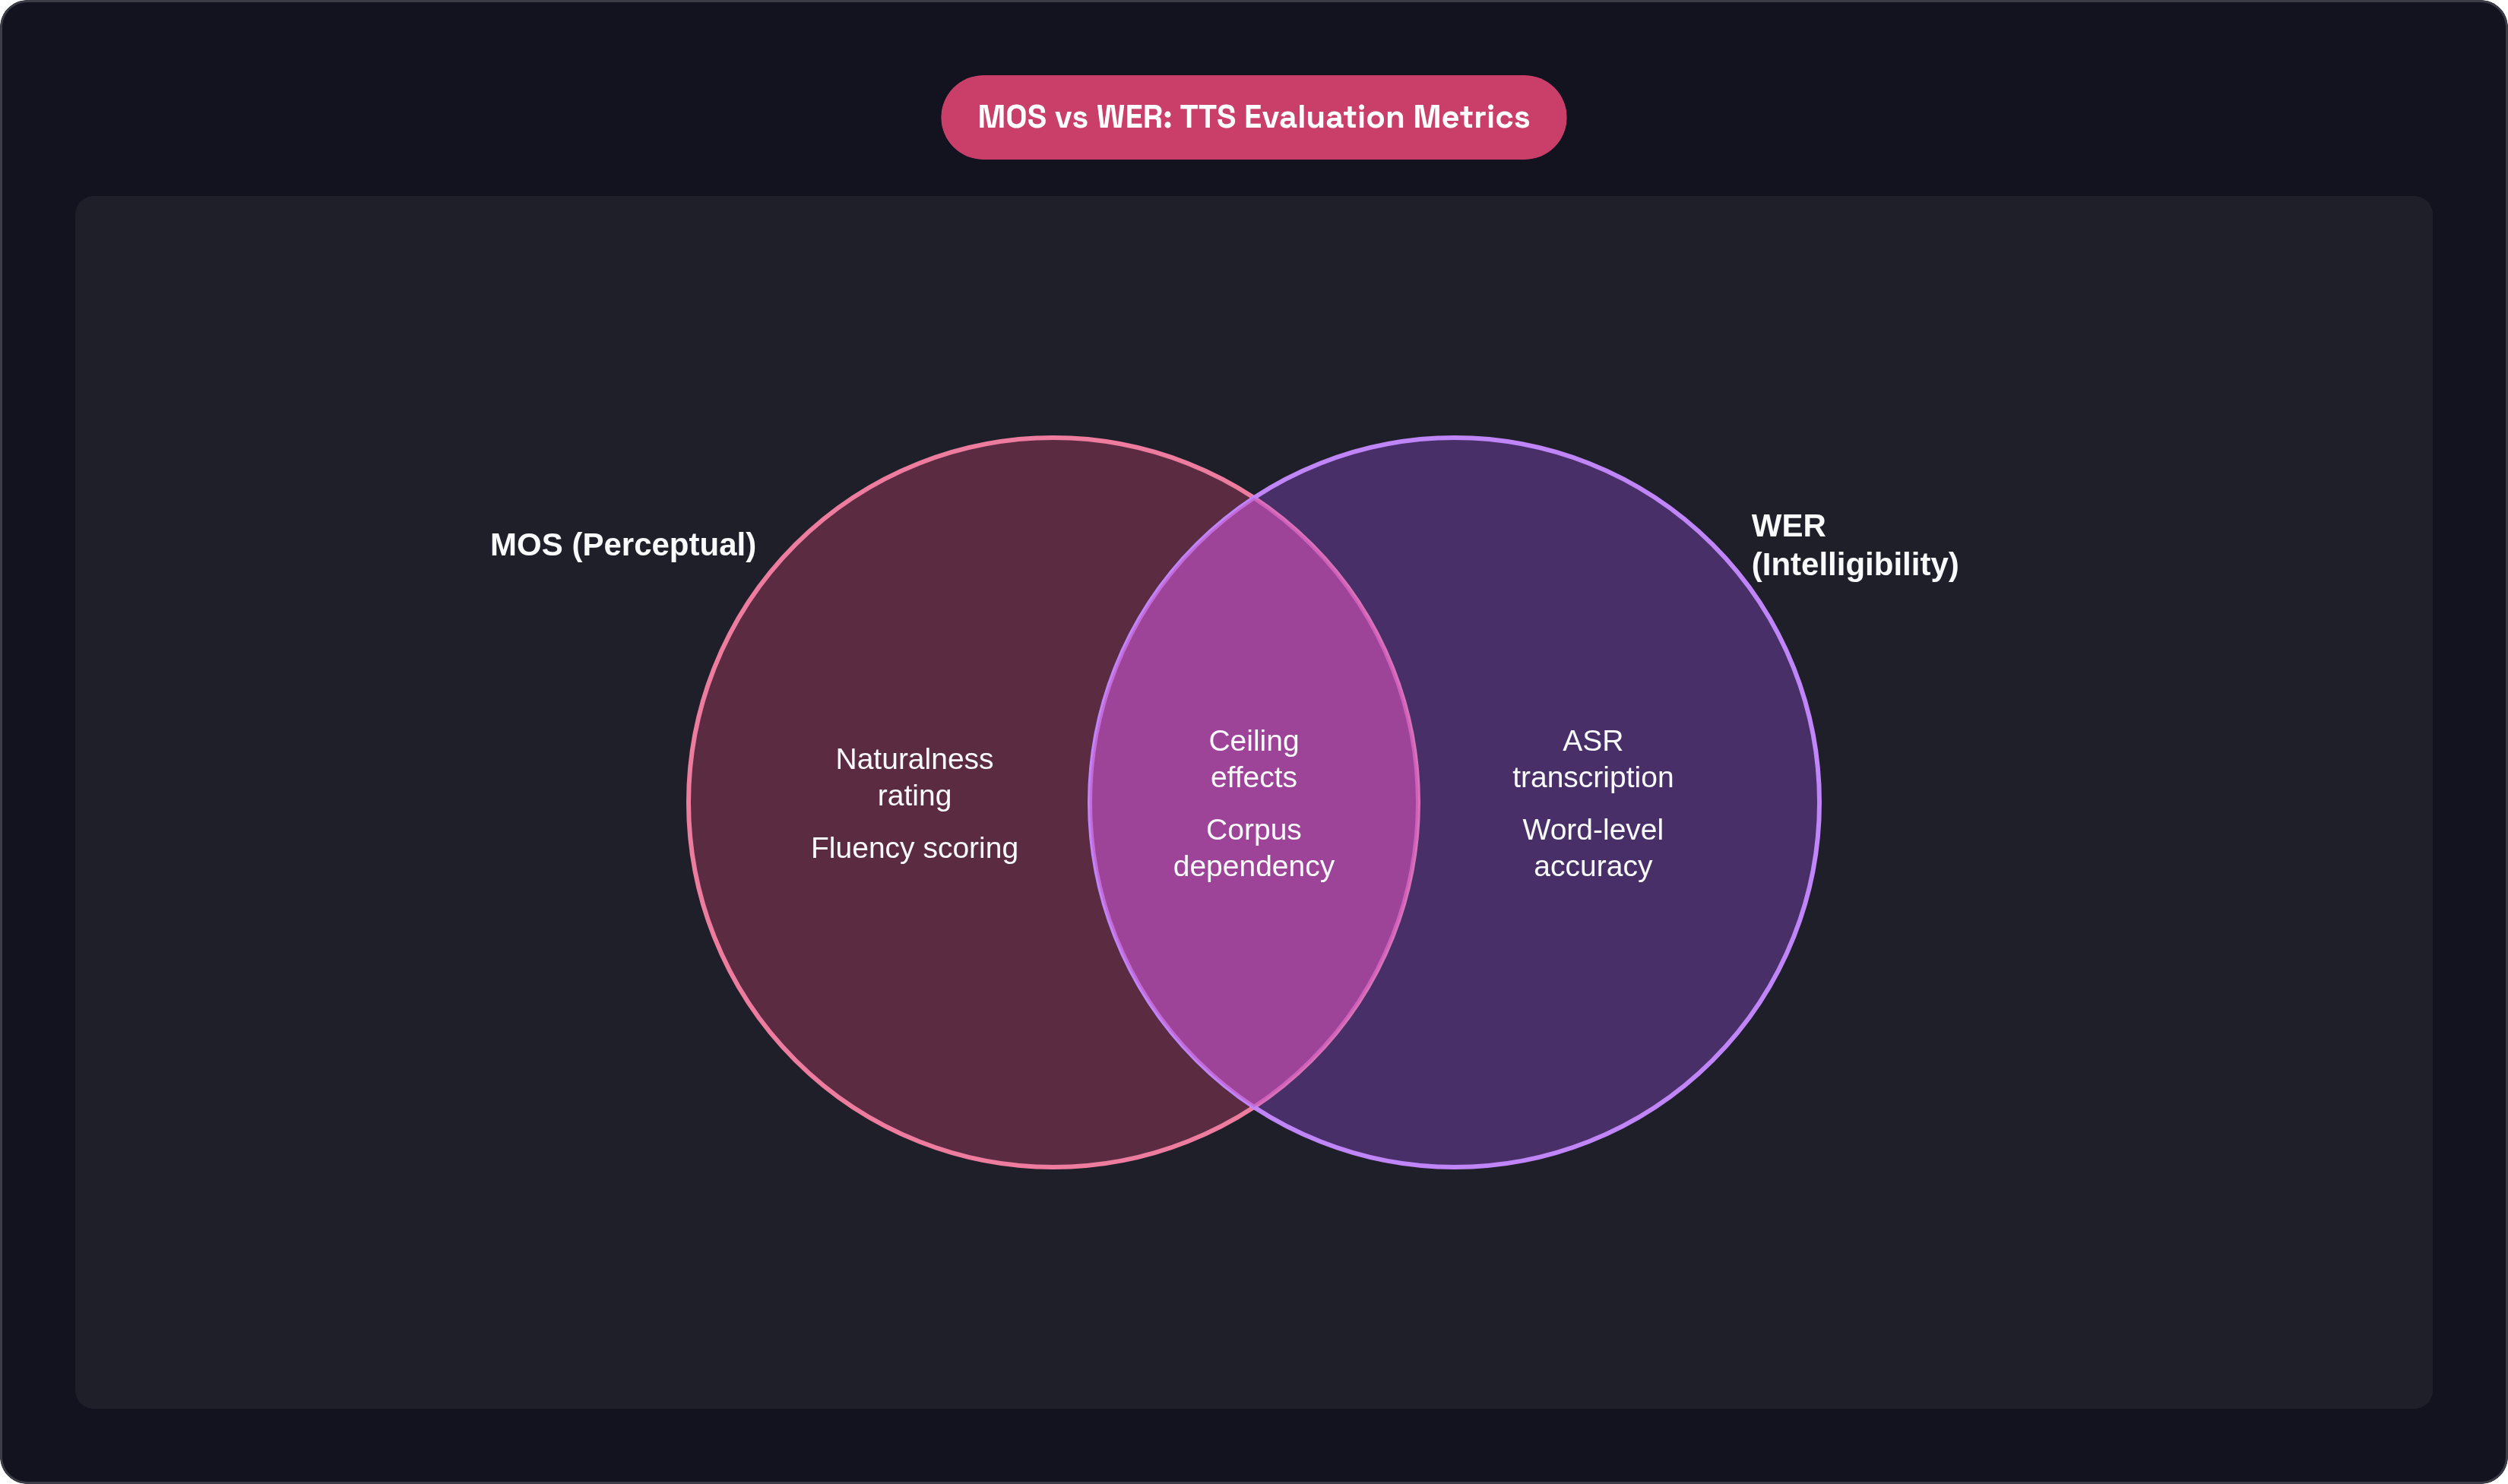
Mean Opinion Score is deceptively simple: human listeners rate synthesized speech on a one-to-five scale, scores get averaged, and the result becomes the headline number. For years, that number was the primary proof of progress. Top commercial systems now regularly breach 4.5 out of 5.0 in blind evaluations, a threshold the test's own logic equates with human speech parity. That's where MOS stops earning its keep.
When every serious contender clusters near the ceiling, the gaps between them are narrower than the noise in the measurement itself. Inter-rater variability, listener fatigue, and sensitivity to acoustic conditions make cross-study comparisons unreliable by design. A score from one lab does not translate cleanly to a score from another, and comparing the two as if they were equivalent is a mistake evaluators make constantly, in published research, on vendor datasheets, and in procurement decisions that should know better.
The variants compound this. Comparative MOS captures pairwise preference between two systems; Speaker MOS targets timbre similarity to a reference voice. A vendor datasheet reading "MOS: 4.4" is reporting any of these, and the label alone tells you almost nothing about which dimension of quality was actually assessed.
Blizzard Challenge researchers proposed decomposing naturalness into five constituent dimensions: clarity, fluency, human-versus-computer perception, pronunciation, and understandability. A single aggregate score collapses distinctions that matter enormously in practice — like trying to judge a symphony by its average volume. A model can score well on fluency while mispronouncing technical terminology, or sound natural on isolated sentences and fall apart on proper nouns. These failures are invisible in the summary number. Which is, frankly, why teams keep shipping models that embarrass them in production.
A score above 4.0 is now the entry fee, not the prize. Any system that clears that threshold needs to be evaluated on dimensions MOS cannot reach.
How WER Measures Intelligibility (and Why Test-Set Choices Undermine Comparisons)
Word Error Rate borrows its methodology from speech recognition: a reference ASR model transcribes synthesized audio, and the transcript is compared against the source text word-by-word. Lower WER indicates better intelligibility. Researchers commonly use Whisper large-v3 as the decoding model, which has settled into something like a de facto standard for the transcription step.
The metric is sound. The problem is what gets fed into it.
A substantial portion of published TTS research uses LibriSpeech's test-clean corpus as the evaluation set, but implementations diverge sharply. VALL-E evaluates on over a thousand utterances; some competing systems evaluate on forty; others use different punctuation handling conventions entirely. These are not minor methodological variations. They produce WER figures that appear commensurable on a leaderboard but are actually incomparable, and no one is required to disclose that prominently. You have to go looking, and most people don't.
The appropriate response to this fragmentation is to generate your own WER measurement. Run it on a corpus that reflects your actual deployment: your target languages, your sentence length distribution, your domain vocabulary. A WER measured against a generic English audiobook corpus tells you almost nothing about intelligibility in a customer support IVR handling insurance terminology.
One technical note that trips people up: WER is the wrong variant for logographic writing systems. Mandarin and Japanese do not segment naturally into discrete words the way alphabetic languages do. Character Error Rate is the correct measure; using WER on Mandarin output produces numbers that are structurally misleading, and seeing those numbers reported without that caveat should make you skeptical of everything else in the same evaluation.
For voice cloning applications, intelligibility alone is insufficient. Speaker similarity, typically computed as cosine similarity between speaker embeddings from models like ECAPA-TDNN, provides a companion measure of how closely the synthesized voice resembles the target speaker. Scores around 0.8 generally indicate strong resemblance, though the threshold shifts by application. Reference recording conditions matter here just as they do for WER: a score computed against studio-quality audio does not predict performance when the reference recording came through telephony compression or a consumer device microphone. That's a gap vendors are rarely eager to highlight.
Automated MOS Predictors and Composite Benchmarks: Faster Evaluation with Known Tradeoffs
Full human listening tests are slow, expensive, and difficult to reproduce. The impulse to automate the perceptual judgment is understandable. Neural MOS predictors like UTMOS and DNSMOS do exactly that: a trained model estimates what a human panel would score, at a fraction of the cost and timeline.
UTMOSv2 from the University of Tokyo has become a widely used proxy in recent research. Higher UTMOS scores correlate meaningfully with more natural synthetic speech across a broad population of systems. For filtering a large candidate pool down to a short list, it is a reasonable instrument.
The critical limitation was surfaced explicitly by the VoiceMOS Challenge: most automated MOS predictors struggle to reliably rank high-quality systems relative to one another. This is precisely the comparison that matters most during model selection, when the field has already been narrowed to the top tier. The predictor performs adequately across the full distribution of system quality and degrades exactly where the decision gets hard. I've sat in evaluation meetings where the UTMOS scores on the finalist systems were effectively indistinguishable, and everyone around the table had to quietly admit the tool had run out of resolution. It was like trying to pick the fastest horse in a photo finish using a sundial. You still need humans at the end.
Composite benchmarks represent a more promising direction. The TTSDS benchmark evaluated a large cohort of TTS systems spanning nearly two decades across multiple factors: prosody, speaker identity, intelligibility, acoustic environment, and general distribution similarity to natural speech. It showed strong correlation with human evaluation, but only when those factors were combined rather than treated individually. More recent work incorporates large audio language model judgments alongside objective tools, targeting content consistency, instruction following, and perceptual quality simultaneously.
Automated predictors belong in pipeline triage. They identify which systems warrant the investment of a human listening study, and that's a genuinely useful function. They do not replace the study, and treating them as if they do is how evaluation processes produce confident, wrong conclusions.
Latency as a First-Class Quality Dimension in Real-Time Deployments
In real-time deployments, latency is a perceptual quality dimension with the same standing as naturalness. A voice agent that sounds beautiful but responds after a two-second pause has already failed the user. It doesn't matter how good the voice is if no one's still listening when it arrives.
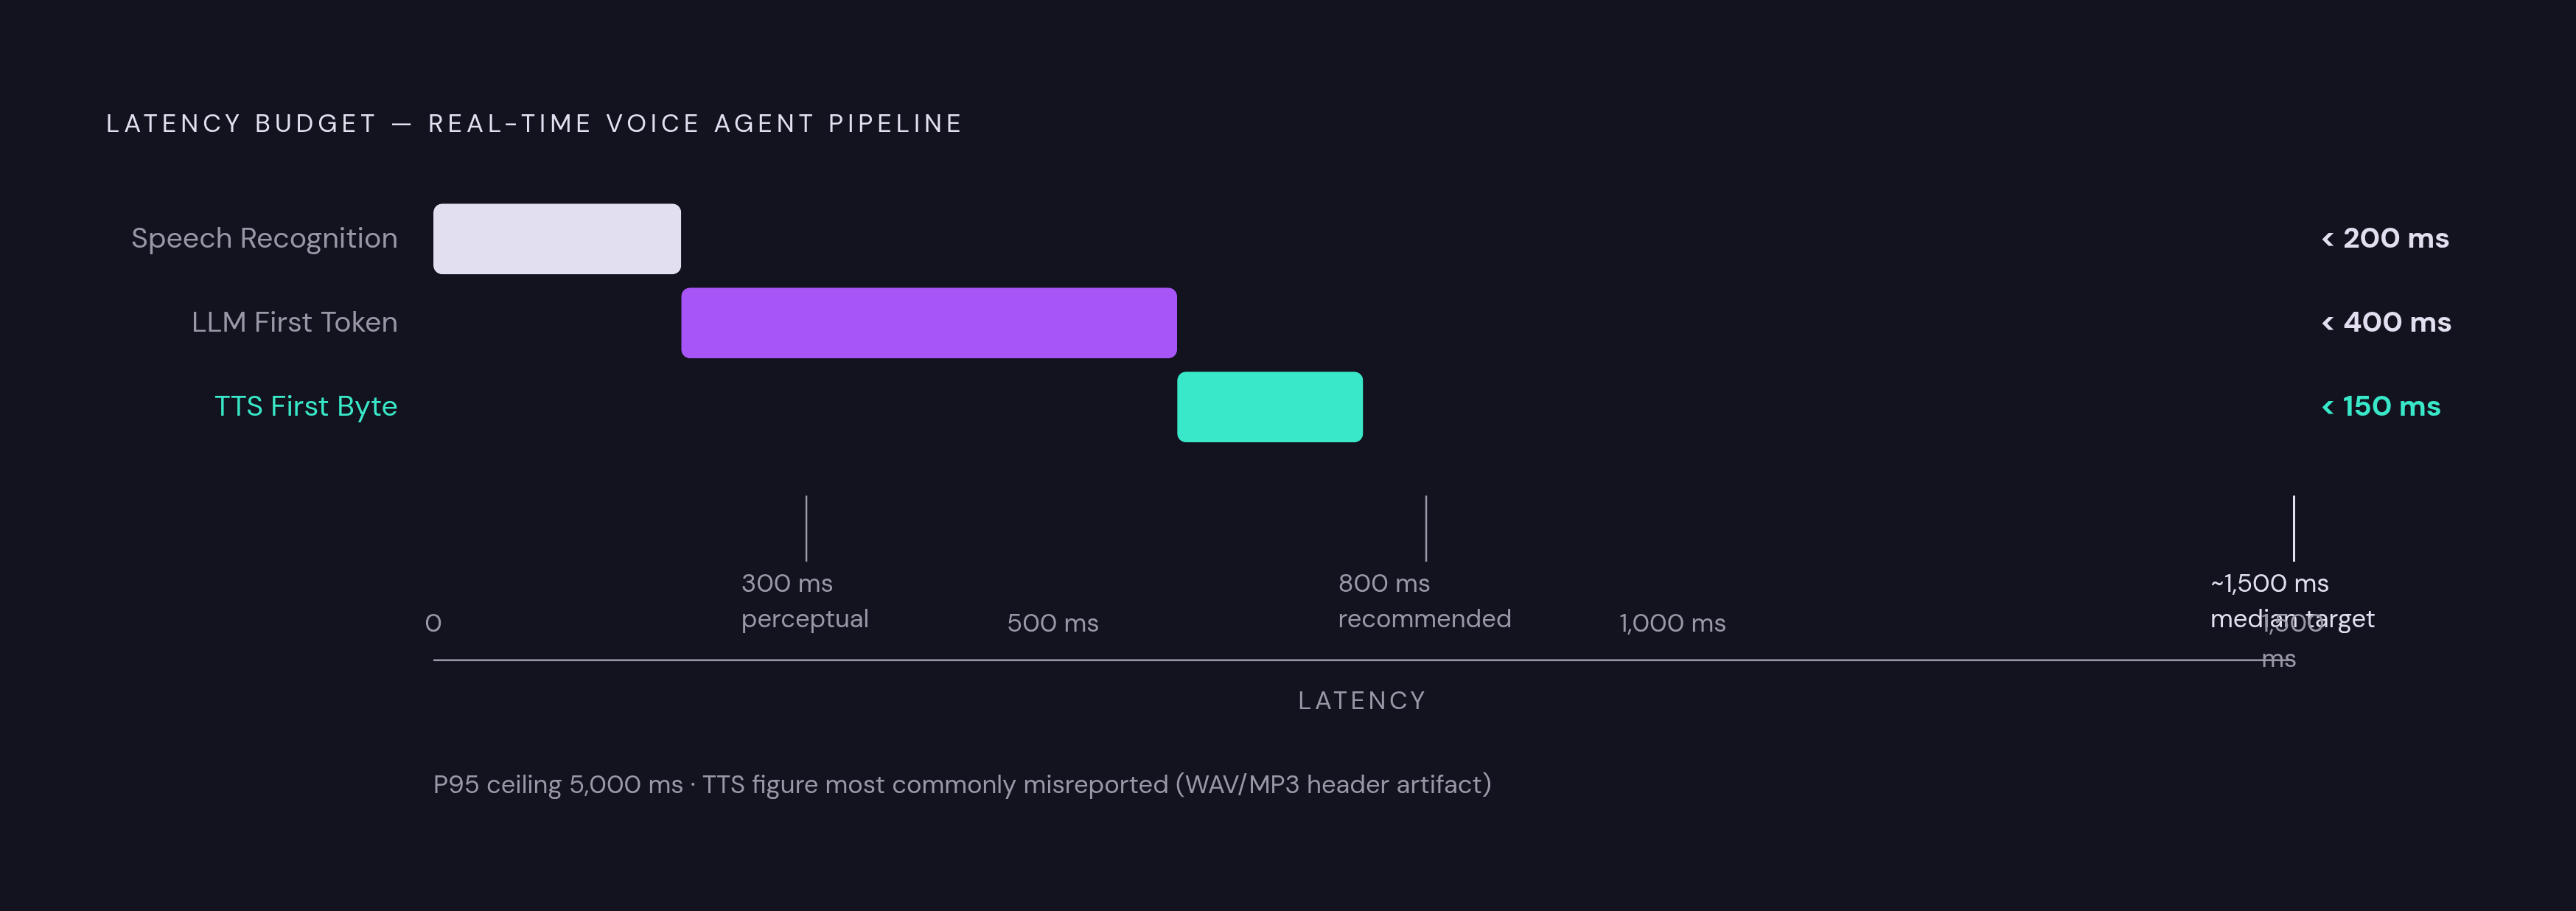
The operative metric for streaming TTS is Time to First Byte: how quickly the first audio chunk arrives after text is submitted. The perceptual threshold for conversational naturalness is under 300 milliseconds; above that, users perceive a delay. For full voice agent round-trips spanning speech recognition, language model inference, and synthesis, the recommended total latency target is approximately 800 milliseconds. Beyond one second, the interaction begins to feel mechanical regardless of acoustic quality.
There is a measurement artifact worth understanding here. Most reported TTFB figures from vendor dashboards measure the arrival of the first bytes from a streaming API response. For audio formats that prepend container metadata, such as WAV headers or MP3 ID3 tags, those first bytes are not playable audio. The actual latency to first audible audio is longer than the dashboard figure, and this definitional mismatch quietly inflates the apparent performance of nearly every system measured this way. It is the kind of thing that looks like a minor technical footnote until you've shipped a voice product and can't figure out why it feels slower than the numbers promised.
In cascading voice agent architectures, production analysis of large call volumes suggests component targets roughly as follows: speech recognition under 200 milliseconds, language model first-token latency under 400 milliseconds, TTS first-byte under 150 milliseconds. End-to-end median latency targets sit around 1.5 seconds; P95 latency under five seconds preserves a usable experience for nearly all calls.
A 500-millisecond average can coexist with a meaningful fraction of calls spiking well above three seconds. Median performance tells you what most users experience; P95 and P99 tell you what the tail looks like. Both belong in any production evaluation.
One architectural optimization is frequently misattributed to the TTS model itself: streaming language model tokens directly to the synthesis engine as they are generated, rather than buffering the complete response before synthesis begins, recovers roughly 100 to 200 milliseconds of total latency. That gain is a property of the integration architecture, not the TTS model. A TTS model can be evaluated in isolation on first-byte latency, but system-level latency depends on whether the surrounding architecture exploits streaming correctly.
Some production TTS offerings, including ElevenLabs, an AI audio company that provides voice cloning and text-to-speech generation through its own foundation models, separate these into distinct model classes: low-latency models targeting sub-100-millisecond first-byte performance for conversational agents, and higher-fidelity models for content creation workloads where latency is not the binding constraint. The separation reflects a design philosophy that treats speed and quality as independent axes rather than a single tradeoff dial, which is the right framing.
The Production Metrics That Benchmarks Don't Cover: Consistency, Multilingual Coverage, and Scale
The metrics discussed above cover the dimensions that appear on leaderboards. Several of the most consequential production failure modes appear on none of them.
Consistency across long-form output is one. A model evaluated on fifty utterances can degrade substantially on sustained synthesis: prosody drift, pacing irregularities, artifact introduction in passages running several minutes. Audiobook pipelines, long-form narration, and extended character dialogue are particularly exposed to this failure type. Discovering it after you've committed to a model, and after you've started production on a multi-hour audiobook, is the kind of experience that recalibrates how seriously you take evaluation design.
Emotional expressiveness and stylistic range represent another gap. Flat prosody that is technically intelligible still fails in applications where the voice carries emotional weight: advertising, character-voiced games, narration that needs to sustain listener engagement across hours. The performance difference between the upper tier and the tier just below it is most visible on this dimension, and no current benchmark reliably captures it.
Multilingual fidelity compounds both problems. WER and MOS benchmarks are overwhelmingly reported on English data. A model's scores on English do not predict its performance in other languages, sometimes not even in typologically similar ones. A single headline number extrapolated across a 70-plus language claim is marketing, not an evaluation. Treat it accordingly.
Voice cloning fidelity under realistic recording conditions also deserves specific attention. Speaker similarity scores published by vendors are typically measured against studio-quality reference audio. Production voice cloning from device microphones or telephony-compressed audio degrades results in ways the standard similarity metric does not predict. Testing against reference recordings that match your actual capture conditions is the only measurement that is relevant to your deployment.
Finally, and this is the thing people consistently underweight: APIs, SDKs, rate limits, concurrency ceilings, and integration ergonomics are evaluation criteria. A synthesis engine that is technically superior but has integration constraints that create production bottlenecks is not superior in deployment. The infrastructure layer of this market is growing faster than the underlying model segment, and ignoring it during evaluation is how technically sound decisions become operational problems.
Mapping Metrics to Deployment Context Before Running a Single Test
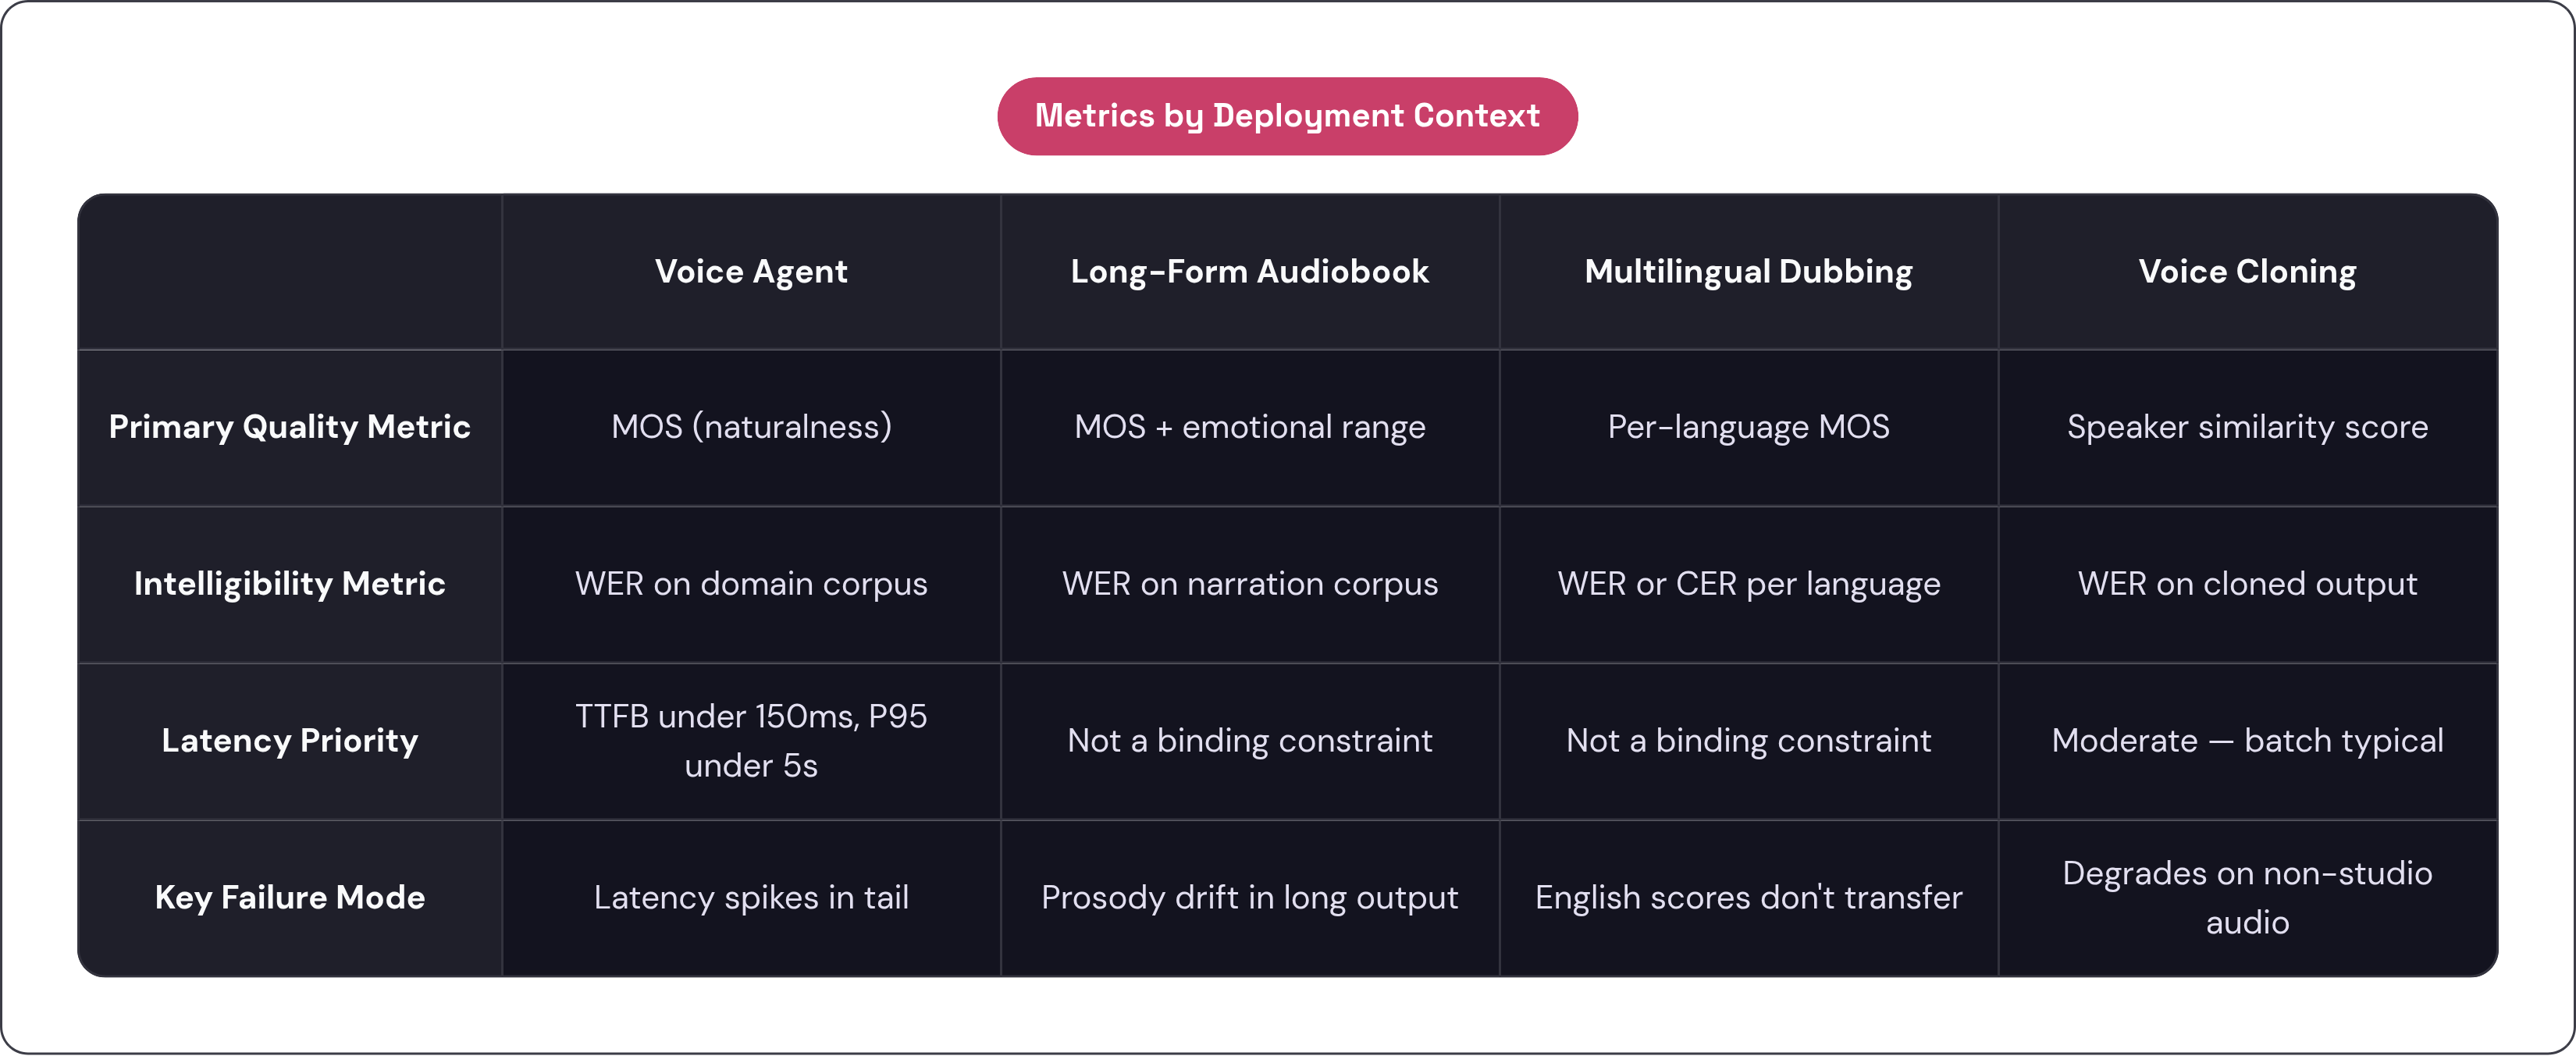
The sequence matters more than most evaluation processes acknowledge. Selecting metrics after selecting candidate systems is how evaluation gets corrupted by availability bias: the metrics that are easy to collect, or that a vendor prominently reports, become the evaluation criteria by default.
Start with a precise characterization of the deployment context: the application type, the language portfolio, the latency requirements, the synthesis length distribution, the recording conditions for voice cloning reference audio, and the deployment tier. From that characterization, the relevant metrics follow directly, without needing to reverse-engineer them from whatever the vendor happened to publish. This sounds obvious. It is not how most evaluations actually proceed.
A voice agent deployment weights TTFB and P95 latency above MOS nuance. A long-form audiobook pipeline weights prosody consistency and emotional range above TTFB. A multilingual dubbing workflow requires per-language WER and MOS evaluation, not an aggregated cross-language figure. These follow from what each use case actually requires, not from what shows up on a benchmark leaderboard.
A defensible evaluation organizes around three axes: perceptual quality, meaning MOS and attribute-specific dimensions calibrated to the application; intelligibility, meaning WER or CER measured on your own corpus, in your target languages, against your domain vocabulary; and production behavior, meaning latency percentiles, concurrency limits, long-form consistency, and integration reliability.
The evaluation corpus is as important as the metric choice. Testing on LibriSpeech because it is available is a reasonable shortcut for academic research. It is not a reasonable shortcut for production selection. The corpus should reflect the actual text domain, sentence length distribution, and language mix of the deployment. Any other choice produces results that are accurate for the corpus and uninformative for the deployment, which is a polite way of saying they tell you nothing useful at the moment you need information most.
Getting the evaluation design wrong defers failure to production, where it is more expensive, more visible, and considerably harder to explain.